
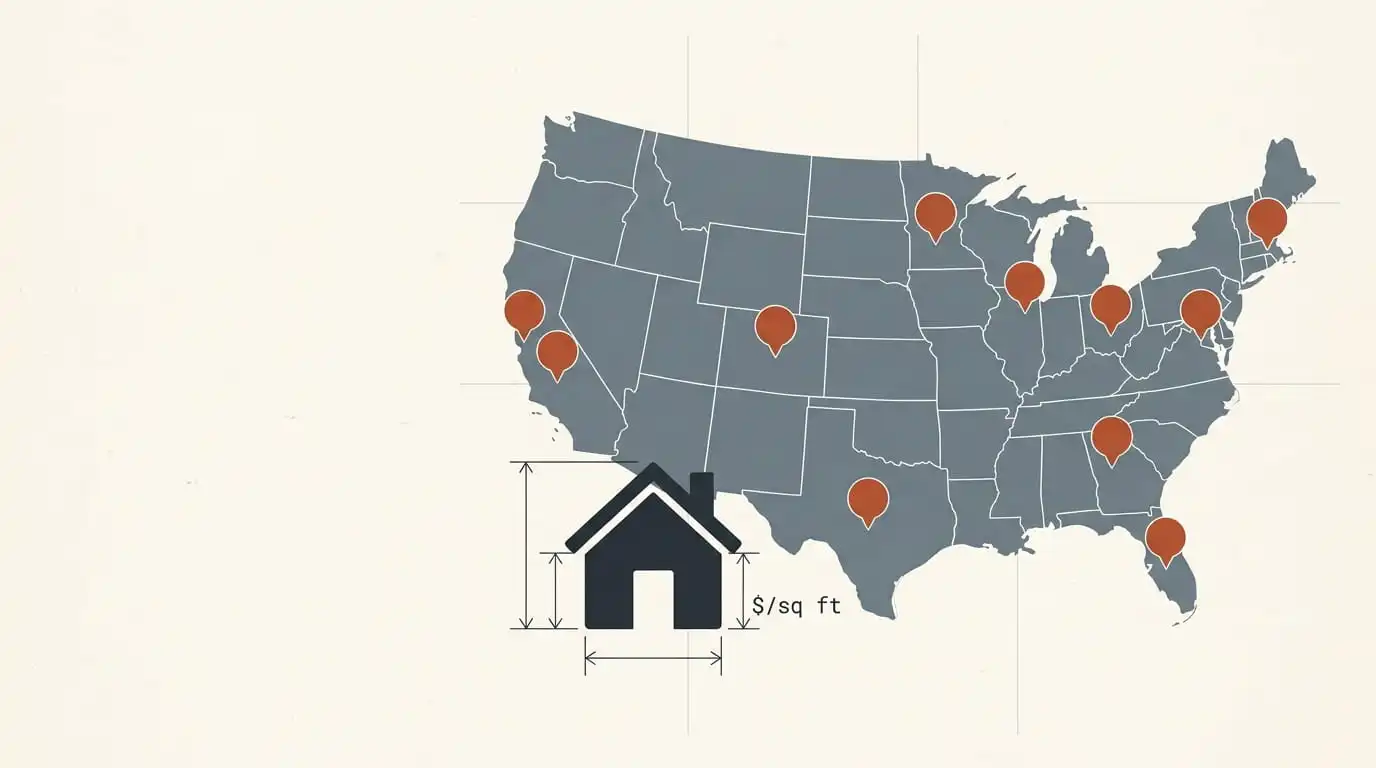
Residential Construction Cost Per Square Foot Calculator
Estimate home construction costs adjusted for your state, quality level, building shape, and square footage — using 2026 NAHB and RSMeans-indexed pricing.
Base cost per sq ft (state-adjusted) across quality classes and home sizes. Highlighted row = your quality class. Highlighted cell = closest to your sq footage.
Figures are $/sq ft. State location factor applied. Overhead & profit not included — add your selected overhead % to these figures for a full all-in cost.
Residential Construction Cost — Estimate Report
A residential construction cost per square foot by zip code calculator answers the question every homeowner starts with: what will building actually cost where I live? Because labour rates, codes and material logistics change across state lines and even between neighbouring counties, national averages mislead almost everyone.
Below, you’ll find the 2026 baseline figures, the multipliers that shift them, and a free tool that localises the number instantly.
What the National Average Actually Is
According to the 2026 NAHB Cost of Construction Survey, the national baseline is $162 per square foot. For a 2,000 sq ft home, that comes to roughly $324,000 before overhead.
Using $162 as your actual cost can be misleading. Quality class alone can more than double the figure, making location just one of several key variables.
How Zip Code Affects Construction Cost
Zip-level pricing comes down to three stacked factors. Rather than a single lookup, your local number is built from:
- State cost index — reflects labour rates, codes and material transport
- Location type — urban cores cost more than rural areas within the same state
- Local market conditions — contractor availability and permit timelines
Together, these explain why a build in downtown Los Angeles differs sharply from one in rural Kern County, despite both sitting in California.
How to translate your zip:
- Select your state for the regional index
- Choose urban for metro cores, suburban for typical developments, rural for outlying areas
- Add 5–10% for restrictive permitting jurisdictions
👉 Try the free construction cost calculator
Construction Cost Per Square Foot by State
The state index multiplies your base figure directly. Here’s how the extremes compare:
| State | Index | Standard-class $/sq ft |
|---|---|---|
| Mississippi | 0.78 | $126 |
| Alabama, Arkansas | 0.80 | $130 |
| Louisiana | 0.82 | $133 |
| Florida | 0.85 | $138 |
| Tennessee, Georgia | 0.88 | $143 |
| Texas, Virginia, Montana | 1.00 | $162 |
| Minnesota | 1.08 | $175 |
| Washington, Oregon | 1.16 – 1.18 | $188 – $191 |
| Illinois, Delaware | 1.20 – 1.22 | $194 – $198 |
| New Jersey, Connecticut | 1.28 | $207 |
| Massachusetts | 1.30 | $211 |
| Alaska | 1.31 | $212 |
| New York | 1.35 | $219 |
| California | 1.38 | $224 |
| Hawaii | 1.44 | $233 |
The same 2,000 sq ft standard build costs roughly $252,000 in Mississippi and nearly $448,000 in California, before overhead.
Construction Cost Per Square Foot in California by Region
California deserves separate attention, since it carries the highest mainland index at 1.38 and enormous internal variation.
Applying location type to the state index:
| Region type | Multiplier | Standard $/sq ft |
|---|---|---|
| Rural (Central Valley, far north) | 0.90 | ~$201 |
| Suburban (Inland Empire, Sacramento) | 1.00 | ~$224 |
| Urban (SF, LA, San Diego cores) | 1.10 | ~$246 |
Add builder overhead at 18%, and urban California standard construction reaches roughly $290 per square foot. Meanwhile, luxury-class urban builds routinely exceed $600.
Furthermore, California’s Title 24 energy code and seismic requirements add costs that lower-index states simply don’t carry.
The Six Quality Classes
Quality class matters more than location for most projects. Each class applies a multiplier against the $162 base.
| Class | Level | Multiplier | National $/sq ft |
|---|---|---|---|
| Class 1 | Economy / minimum | 0.75× | $100 – $130 |
| Class 2 | Builder grade | 0.90× | $130 – $160 |
| Class 3 | Best standard | 1.00× | $160 – $220 |
| Class 4 | Good / upgraded | 1.30× | $220 – $280 |
| Class 5 | Semi-luxury | 1.60× | $280 – $380 |
| Class 6 | Luxury / full custom | 2.10× | $380 – $600+ |
Notably, Class 6 costs nearly three times Class 1 on identical square footage. Therefore, be realistic about finish level before comparing any zip-code figures.
Why Building Shape Changes the Price
Square footage alone ignores complexity. Since every corner adds framing time, cutting waste and flashing detail, footprint shape carries a measurable surcharge.
| Corners | Shape | Surcharge |
|---|---|---|
| 4 | Simple rectangle | Baseline |
| 6 | One offset | +3% |
| 8 | Two offsets | +6% |
| 10 | Complex footprint | +10% |
On a $400,000 build, a ten-corner design adds around $40,000. Simple rectangles may look plainer, but the savings can often go toward better interior finishes.
Where the Money Actually Goes
Understanding cost distribution helps you target savings. Based on 2026 NAHB breakdowns:
| Category | Share of cost |
|---|---|
| Mechanical (HVAC, plumbing, electrical) | 24.8% |
| Finishes and interiors | 19.6% |
| Framing and structure | 17.2% |
| Foundation and site | 14.8% |
| Roofing and exterior | 12.4% |
| Windows, doors and garage | 11.2% |
Mechanical systems being the largest line surprises most people. This work is code-driven and labour-intensive, making it one of the hardest categories to economise on safely.
Builder Overhead and Profit
Every quote includes this, yet it rarely appears as a separate line. NAHB data puts typical overhead and profit at 15–20% of base construction cost.
That covers:
- Project management and site supervision
- Insurance, bonding and licensing
- Office administration and estimating
- Warranty reserves
- The builder’s actual margin
On a $350,000 base, overhead adds $52,500 to $70,000. Don’t view it as padding. It covers the cost of coordinating twenty subcontractors yourself.
How to Use the Calculator
Follow these steps for a localised figure.
1 — Select your state
Start with the state index, as it affects every cost that follows.
2 — Choose your location type
Classify your ZIP code as urban, suburban, or rural based on population density rather than mailing address.
3 — Pick a quality class
Read the descriptions carefully. Most people who select “standard” actually want Class 4 finishes.
4 — Set your building shape
Count the corners on your floor plan, including any bump-outs.
5 — Enter square footage
Use the slider for exploration, or type an exact figure once you have drawings.
6 — Adjust overhead
Leave it at 18% unless a builder has quoted differently.
7 — Check the reference table
Compare your quality class against neighbouring classes at your square footage.
8 — Export the report
Download the PDF for lender and builder conversations.
What the Estimate Excludes
Construction cost is only part of a build budget. Plan separately for:
- Land purchase — enormously variable by zip
- Permits and impact fees — $2,000 to $50,000 depending on jurisdiction
- Site preparation — clearing, grading and excavation
- Utility connections — $5,000 to $30,000 by distance
- Architectural and engineering fees — typically 5–15% of construction
- Construction financing — interest during the build period
- Landscaping and driveway — often forgotten entirely
Realistically, expect these to add 20–35% on top of the construction figure.
Frequently Asked Questions
Is the residential construction cost per square foot by zip code calculator free?
Yes, it’s completely free with no sign-up required. Download a PDF report or copy the full breakdown.
Does it work for every US state?
It covers all 50 states plus DC, each with its own cost index. Then location type refines the figure toward your specific area.
What’s the average construction cost per square foot in the USA?
The 2026 NAHB national average is $162 per square foot for standard construction, excluding builder overhead.
How accurate are zip code construction estimates?
Expect roughly ±20–25% for planning purposes. Since no calculator sees your lot, plan or local bid environment, treat the output as a range rather than a quote.
Why is California construction so expensive?
Three reasons compound: high labour rates, strict energy and seismic codes, and lengthy permitting. Combined, they push the state index to 1.38.
Should I add overhead to the reference table figures?
The table shows the base cost per square foot. Add your overhead percentage to calculate the all-in cost.
Get Your Local Estimate
Enter your state, quality class, and square footage to get a localized estimate instantly. Compare the contractor’s bid with the estimated range to assess its reasonableness.
10 thoughts on “Residential Construction Cost Per Square Foot by Zip Code Calculator”